Move your mouse over the map to zoom in for a closer look at your area.
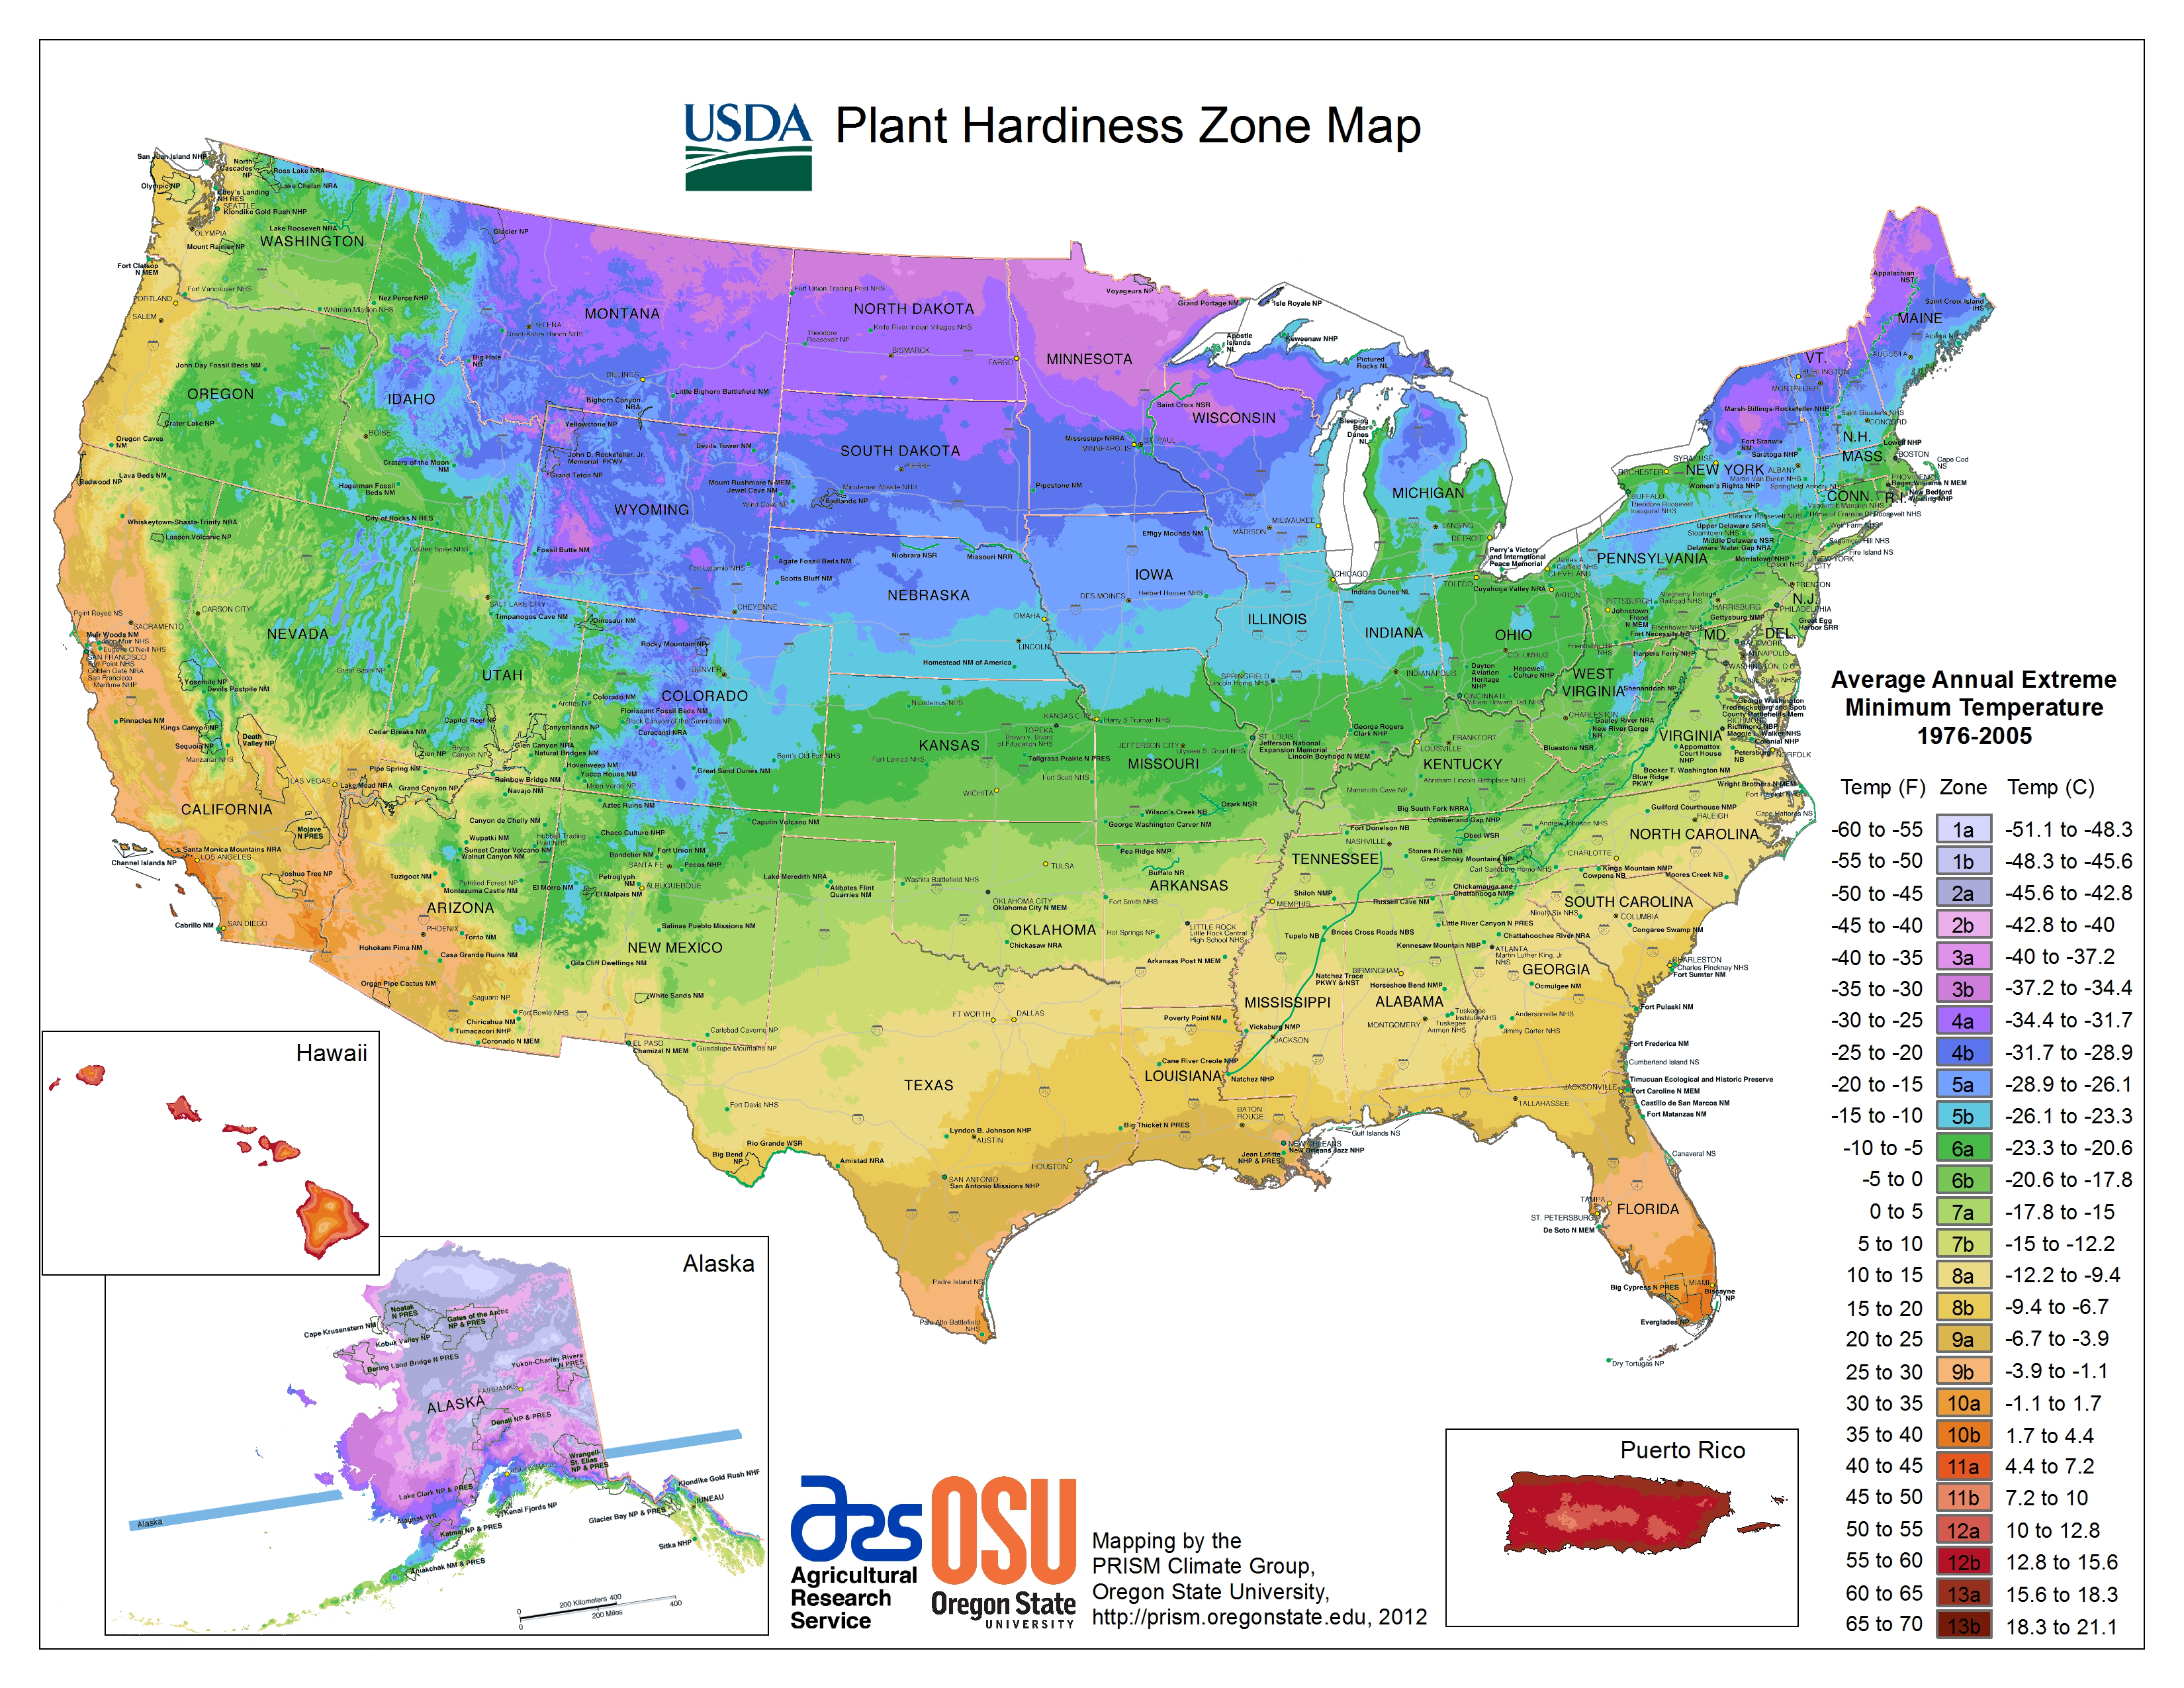
The latest version of the USDA Zone Map was jointly developed by USDA's Agricultural Research Service (ARS) and Oregon State University's (OSU) PRISM Climate Group, and released in January of 2012. To help develop the new map, USDA and OSU requested that horticultural and climatic experts review the zones in their geographic area, and trial versions of the new map were revised based on their expert input.
Compared to the 1990 version, zone boundaries in the 2012 edition of the map have shifted in many areas. The new map is generally one 5°F half-zone warmer than the previous map throughout much of the United States. This is mostly a result of using temperature data from a longer and more recent time period; the new map uses data measured at weather stations during the 30-year period 1976-2005. In contrast, the 1990 map was based on temperature data from only a 13-year period of 1974-1986.
However, some of the changes in the zones are a result of new, more sophisticated methods for mapping zones between weather stations. These include algorithms that considered for the first time such factors as changes in elevation, nearness to large bodies of water, and position on the terrain, such as valley bottoms and ridge tops. Also, the new map used temperature data from many more stations than did the 1990 map. These advances greatly improved the accuracy and detail of the map, especially in mountainous regions of the western United States. In some cases, they resulted in changes to cooler, rather than warmer, zones.
Click here to view the 1990 map, and to lookup your zone by zipcode