It's confusing...
But actually powerful.
Make sure you read the right chart... use the fall chart if you want to time your autumn plantings. My example below uses the spring chart, but reading both charts are the same.
Here is my attempt to explain it when others asked:
kenisaac said: Welcome!
I assume you are trying to use the frost dates tool. It SHOULD display a chart like this after entering your zip code. On my phone, it doesn't display the chart correctly, and that might be what you see instead of this chart.
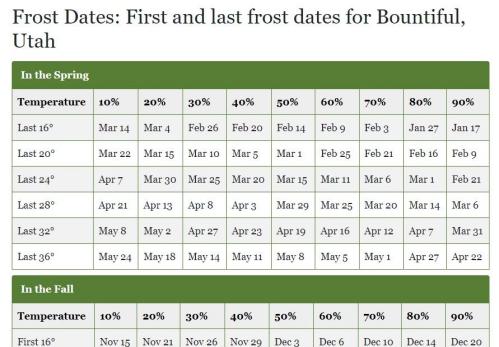
If you see the chart-
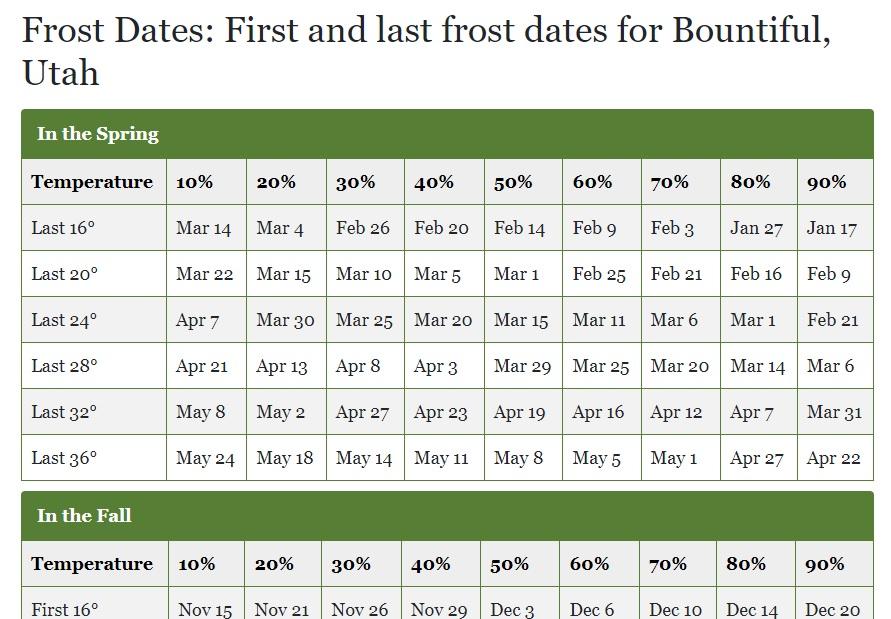
First, find the first chart that says "in the spring" to know it is springtime you are looking at.
To read it, you need to choose a TEMPERATURE (from the column on the left) and choose a PERCENTAGE, from the row headings on the top. Nine dates for each temperature are given.
The intesection of those choices, of TEMPERATURE and PERCENTAGE will predict the date, based on past climate data, that you might experience that temperature.
Lets try 32 deg: From the colum on the left, find "last 32 deg." On the row across the top, find 50%. The date displayed on the intersection of the temp. row and the percentage column is april 19th for my zip code- (on the screenshot I displayed.) Thus, half of the past years, (50% of the years) the last 32 deg. was very near April 19th.
The power of this chart is to calculate the risk you are willing to take- and local farmers must do this every year as they decide when to plant their fields. If I'm a new gardener and I want to play it pretty safe, I'll plant the tender vegetables around May 2nd, as the chart predicts only 20% of the past years had a frost near or later than this date. That's only 2 years out of the last ten years did that frost happen then or later. This is the date the garden centers and all the "experienced farmers" will tell you is the last frost date in my area.
As you get more experience with your micro-climate of your garden, and your ability to protect from frost, you'll move your planting dates earlier, so you get a longer summer harvest. The climate data is also changing, and the U.S. on the whole is beginning to track a longer frost-free period. It will take many years before these changes reflect in these charts, but if you watch your local weather station reportings, and track it with an outdoor thermometer in your garden, these trends become visible. Also, remember that the data gathering weather station for your city (zip code) may not be near your garden, so the data may not be accurate for you!
https://garden.org/thread/view...