Post a reply

Image
Dec 21, 2019 8:20 AM CST
Name: Meghan Davis
Maryland (Zone 7a)
Daylilies
Hello Daylily Knowledge Cloud:

I realize this is an older thread and was wondering about any updates to options and recommendations for software for tracking hybrids that allows incorporation of photos and metadata like bloom times, scape characteristics, etc. I'd really like to be able to generate "family trees" with photos.

I've taken a peek at Plantstep, but since I have a Mac, and since my Windows environment through parallels is so outdated it won't run (so I'm looking at new parallels and new windows software as added costs), I was wondering what other options there are.

I already have created a simple home-grown (pun intended) database using excel and some statistical software packages I use for work, and these can handle a lot of report generation. What I really want is the ability to create multigenerational family trees that use photos.

Thanks for the thoughts!!
Meghan
Avatar for Kaylily
Dec 21, 2019 9:19 AM CST

[quote="megdavis"]Hello Daylily Knowledge Cl

You may want to check out https://gardentracker.com/

One of the Facebook Daylily groups were talking about it and many said it is better than Plantstep. I have not used it personally.
Image
Dec 21, 2019 9:46 AM CST
Name: Meghan Davis
Maryland (Zone 7a)
Daylilies
Kaylily said:You may want to check out https://gardentracker.com/

One of the Facebook Daylily groups were talking about it and many said it is better than Plantstep. I have not used it personally.


Thanks!!
Image
Dec 21, 2019 10:07 AM CST
Name: Sue
Vermont (Zone 5a)
Daylilies Dog Lover Hybridizer Canning and food preservation Garden Procrastinator Seed Starter
Plant and/or Seed Trader Region: Vermont
Meghan,
If you can use MS Access on your Mac, I recommend it. I started with Excel, and moved over to Access for its ability to handle photos and queries. The export from my Excel file of over 500 crosses was easy. I have the ability to customize fields of course, add photos and generate reports. I am hoping to structure a report along the lines (generational) that you suggest, but haven't done it yet (no current need)

If you are at all technical, I believe that the out-of-the-box programs are limited and cumbersome to use. (Your mileage may vary)

The only reporting difficulty I have found is that there is a limit in the number of columns you can use in a report. Because of this, when I wanted to make a garden map of my various seedling beds, I had to make an export to Excel for this purpoose.
Suevt on the LA
Image
Dec 21, 2019 10:29 AM CST
Name: Meghan Davis
Maryland (Zone 7a)
Daylilies
SueVT said:
If you can use MS Access on your Mac, I recommend it. I started with Excel, and moved over to Access for its ability to handle photos and queries. The export from my Excel file of over 500 crosses was easy. I have the ability to customize fields of course, add photos and generate reports. I am hoping to structure a report along the lines (generational) that you suggest, but haven't done it yet (no current need).


Thanks Sue! Very helpful!!

I am pretty technical on the user side (coding within applications) but not on the software developer side (no thanks, too hard to stay current). As a rule, I despise Microsoft, but will take a peek at the current capabilities of Access to see if my function needs fit the current catalogue of features. (I've long since moved beyond Access for database management for my scientific studies; we have much better options now for clinical research.) I've considered using software programs built for genetic analysis that create phylogenetic trees, but think these will also be cumbersome since they aren't at all built to task. I've also considered to try to customize human family tree software, but again, think this will be a lot of work that will probably have to be repeated as these software programs are updated.

In the next couple of weeks while my institution is on term break, I plan to test all viable options I can identify. If I go with Access and figure out the generational trees, I'll come back and post a how-to guide.

I love hearing the diversity of ideas out there!
Image
Dec 21, 2019 10:53 AM CST
Name: Sue
Vermont (Zone 5a)
Daylilies Dog Lover Hybridizer Canning and food preservation Garden Procrastinator Seed Starter
Plant and/or Seed Trader Region: Vermont
Hi Meghan,
I started out as a developer and moved to management over the years. If heavier-duty databases are available to you, might be a good option. I have a back burner project to construct a more "serious" daylily database for myself in the MEAN framework. More serious -> more ability to create really useful output.

Access is just something I have used in the past (mostly in the 90's), and it is included in my Office 365 subscription. So no extra trouble at this point. For me, it is just pure fun (most of the time). Smiling

Garden map (bed A), showing a bit of rows 13-17, out of 21 rows in this bed

Thumb of 2019-12-21/SueVT/2e7d66

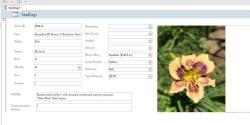
Seedling item page in Access: (I think I have added a few fields since I took this screenshot)


Thumb of 2019-12-21/SueVT/41b46e
Suevt on the LA
Image
Dec 21, 2019 11:25 AM CST
Name: Meghan Davis
Maryland (Zone 7a)
Daylilies
SueVT said:Hi Meghan,
I started out as a developer and moved to management over the years. If heavier-duty databases are available to you, might be a good option. I have a back burner project to construct a more "serious" daylily database for myself in the MEAN framework. More serious -> more ability to create really useful output.

Access is just something I have used in the past (mostly in the 90's), and it is included in my Office 365 subscription. So no extra trouble at this point. For me, it is just pure fun (most of the time). Smiling

Garden map (bed A), showing a bit of rows 13-17, out of 21 rows in this bed

Thumb of 2019-12-21/SueVT/2e7d66

Seedling item page in Access: (I think I have added a few fields since I took this screenshot)


Thumb of 2019-12-21/SueVT/41b46e


Sue, what a pretty seedling! Thanks for sharing the screenshots, super helpful!

I think I'm basically doing the same thing in my statistical package (Stata 16 for those who use such things, very similar to SAS, R, SPSS or Matlab) and can both input and generate similar data output variables, but without the fancy formatting or a simple feature to include the photo in my output. (I could include a hyperlink pretty easily, and I probably could move to open-source software and write a macro if I had enough time.)

Love your seedling bed output, so useful!! I'm just getting to the point where I need to track sdlg location within a bed. I wonder if there is a way to integrate spatial software packages (ArcGIS pricey and proprietary v open-source R software) or even just a way to output x,y data to Google Maps for more extensive bed plantings. I don't have enough land (only a usable acre or so, less if I respect my partner's preference to retain some actual lawn) but I can imagine the serious hybridizers might benefit from map generation features.

If you go down the path of software development (please do!), consider me on board to help beta test!!
Image
Dec 21, 2019 12:28 PM CST
Name: Meghan Davis
Maryland (Zone 7a)
Daylilies
As an addendum for those following this thread to learn more about how other people organize their daylily information, here's what I can do in my statistical software package.
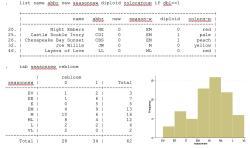
Thumb of 2019-12-21/megdavis/9829ff

I am growing, not just founder stock for daylily hybridizing, but also garden needs (full season of blooms from EE to VL, timing of bloom relative to other plants) and I am taking the daylily preferences of three other family members into consideration. This output was designed to help me make decisions about new daylilies to acquire in 2020. The top output was a list of my doubles, with their dominant color, dip/tet status, and bloom time listed. The bottom output shows the bloom time, with rebloomers noted, and on the right is a histogram of bloom season by registration. You can see I currently have 62 cultivars and more than half are rebloomers. I have a lot of mid-season (EM, M and ML) but far fewer early (EV, EE, E) or late (L, VL). Looking at this output, I decided I needed more doubles, particularly early or late season, and I needed more early or late season daylilies overall.

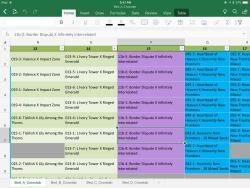
Here's what I do for bed location. All my beds are named, and I have this in the database such that I can list the daylilies according to any criterion I want. This shows the list ranked by scape height. I also have versions that include the new daylilies I want to add, and I use this system to help plan where I will put them, since (as many people do) I like to have the shorter-scape daylilies in front, but I also think about when daylilies bloom and sometimes will pair similar-height daylilies, one in front of the other, as long as they bloom at different times (of day: nocturnal v. diurnal, and of season: E v L).

Thumb of 2019-12-21/megdavis/5af104

As you can see, the output is basic (no frills, no photos). I code more in Stata (moderate cost, but a bit faster to learn than some programs, more information at: https://www.stata.com), and I also do some coding in R-software (free and open-source, information at https://www.r-project.org, with Coursera and other free online courses and tutorials available, but it has a steeper learning curve). I have a version of Stata that allows so many rows and columns that my daylily database is functionally unlimited in terms of data points.

The two major limitations to these kinds of programs are:
1. Users need at least some coding ability (usually takes most our our students 6 months to achieve a reasonable level of competency, given specific coursework and homework assignments designed to improve skills, but it is possible to gain many skills without the structure of a training program since the online community that supports these packages is soooo good).
2. Photos difficult to include, may be able to do via hyperlinks and/or macros (extensive coding skills needed). I have identified a few potential pathways that would let me do what I want to do with R software, but this approach would take me a LOT of time, and I have a bunch of students to graduate this year!

I hope this whole thread has been useful to those who want to think about a variety of options for management and visualization of our awesome daylily data! The main daylily database is such a wonderful resource, and I really am thrilled at the knowledge base among the community here!!

Meghan
Image
Dec 21, 2019 1:51 PM CST
Name: Sue
Vermont (Zone 5a)
Daylilies Dog Lover Hybridizer Canning and food preservation Garden Procrastinator Seed Starter
Plant and/or Seed Trader Region: Vermont
I absolutely love this! It is so important to understand the statistics around our plants, and you have the skills and software to really do this.

Very exciting stuff, I am going to read more about it. Thank You!
Suevt on the LA
Image
Dec 25, 2019 7:19 AM CST
Name: Becky
Sebastian, Florida (Zone 10a)
Celebrating Gardening: 2015 Daylilies Hummingbirder Butterflies Seed Starter Container Gardener
Charter ATP Member I was one of the first 300 contributors to the plant database! Garden Ideas: Master Level Lover of wildlife (Black bear badge) Birds Ponds
Meghan - The software you are using is impressive! Hurray! Thumbs up
What lies behind us and what lies before us are tiny matters, compared to what lies within us.
Garden Rooms and Becky's Budget Garden
Image
Dec 25, 2019 8:42 AM CST
Name: Meghan Davis
Maryland (Zone 7a)
Daylilies
beckygardener said:Meghan - The software you are using is impressive! Hurray! Thumbs up


Thanks! It's the same software (Stata) that I'm using for the ADS data output:
https://garden.org/thread/view...

You must first create a username and login before you can reply to this thread.
Member Login:

( No account? Join now! )