The gist of this post: When we take two plants of the same cultivar and plant them side by side to compare them we should always assume that they will be different even if we divided a double fan crown to produce the two single fans (or a four fan crown to produce the two double fans) to plant and nothing had ever been done differently to those fans.
We should never assume that the two plants will be the same or should be the same just because they are planted beside each other.
If we look at a clump of a daylily cultivar in flower we will notice many differences. Some of the fans are small and some are large. Some develop a scape and some do not flower. Some scapes are taller than others. Some scapes have more branches than others. Some flowers are smaller than others. In other words there is a large amount of variability.
There is variability in everything that is related to growing plants. One of the most important causes of some of that variability is the soil. We often make the assumption that the soil is the same for plants because we water and we fertilize. But it is not. In any area there are patterns in the soil that affect plant growth. Those patterns mean that even if we place two plants side by side they will be growing in different conditions and that means that they will be different because of those different conditions no matter what effect we thought we were testing by planting them side by side.
The figure below is a simple test done more than 80 years ago. An entire field was planted with one variety of beets. Rows were 22" apart and the beets were thinned to 12" apart in the rows. When the beet roots were harvested their weights were measured along with their location in the field. The figure shows how much the weight of the roots differed from the overall field average for different locations in the field.
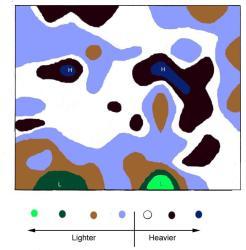
There are gradients throughout the field. No matter how close one puts two plants one plant will be in a different location in the gradient versus the other. The different locations will have different minerals (N, P, K, etc.) and differences in other factors that affect plant growth and all those unknown differences will cause the plants to grow differently.
More recent research into the variability of soil has looked at the actual amounts of various minerals in the soil. Nitrogen is one of the most important for plant growth. When 1 m x 1 m sections (areas 3.3 ft x 3.3 ft) of a field were examined there could be as much as two to three times the amount of nitrogen in different areas. When 12.5 cm x 12.5 cm sections (5" x 5") were examined the amount of nitrogen could vary by as much as 10 times. Those differences will cause plants (even divisions or clones) to be different even when planted side by side or near each other.
How do we design a test so that we can more or less safely assume that the natural variability in the soil (and in all other factors that affect plant growth, such as amount of shade, temperature differences, etc) are not the cause of any differences we see? We have to use many plants and we have to plant them in several different locations at random. By doing so we even out the differences between locations (when we use averages of the measured characteristics we are interested in comparing). And we have to repeat the entire test several times.
Lets say we do the test only once. For this example consider two opaque containers. In both containers someone has placed some unknown number of white beans (from 0 to 50) and some unknown number of red beans (from 0 to 50) for a total bean count of 100 beans in each container. We are going to remove two beans from each container. We cannot see into the containers. From container one we get two beans and both are red. From container two we get two beans and both are white. We decide that container one is full of only red beans and container two is full of only white beans. We are probably wrong. Both containers may have exactly the same number of white and red beans. Even if both containers have 50 white beans and 50 red beans we could get just two white beans from one container and just two red beans from the other container. If that was the case we would actually get two white beans one quarter of the time from one container and two red beans one quarter of the time from the other container. If that was what happened when we did our sampling then statistics tells us that we should not conclude anything. We do not have results that are statistically meaningful or informative. We need to repeat the test several times. As well we should increase our sample size - instead of just two beans perhaps we should take out four beans from each container. Simply because we see a difference between two groups or samples does not necessarily mean that the difference is significant. It does not necessarily mean that the same difference will be present if we repeat the entire test. It does not necessarily mean that the difference is real in general. We use statistical tests to help us decide if the difference is significant and reliable.
For a test to produce results that actually relate to the effect the grower is interested in testing and not caused by all the other unknown factors that affect plants one should probably have as a very minimum 30 plants, three sets of five treated one way and another three sets of five treated in the other way. The plants would need to be chosen at random for each set of five. One set of five from one group would need to be paired at random with a set of five from the other group. Each of the three sets would need to be planted in a location chosen at random in the growing area. In each of the three locations the first group of five to be planted would need to be chosen at random.
One possible scenario (choosing at random means using dice or random number tables, etc. to make the decision of which group to plant where in each location, for example, roll one die - if it is 1, 2 or 3 then row 1 is group A otherwise it is group B, in location 1):
Location 1 row 1 (chosen at random) five plants of A, row 2 five plants of B.
Location 2 row 1 (chosen at random might be) five plants of A again, row 2 five plants of B
Location 3 row 1 (chosen at random) five plants of B, row 2 five plants of A.
Whatever we measure should be averaged and compared using simple statistics as a minimum, to take into account the variability that is always present no matter what we do. Most of the simple, but informative statistical tests are available on the internet (or often in spreadsheet programs); one just needs the measured characteristics.